Flow Beats Busy: The One-Metric Fix for Engineering Teams
Stop Starting, Start Finishing: The 30-Day WIP Diet
The 17-Ticket Tuesday
Elena squints at her Jira board: seventeen “In Progress” cards wobble in the same lane, not one close to Done. She ricochets between a flaky test, a half-wired feature flag, and two “quick” bug fixes. By noon, her IDE is a tab graveyard—and nothing has shipped.
Utilization: 100 percent.
Throughput: zero.
The only metric climbing is Elena’s blood pressure. That’s the cruel math of work-in-progress (WIP) overload: the more plates you spin, the fewer meals reach the table.
Flow vs. Utilization: The Hidden Throughput Paradox
Little’s Law is a neat formula for assessing queuing systems. What does it mean for us in plain English?
Lead time = Work in Progress x Throughput.
When WIP balloons, lead time stretches like cold chewing gum.
Try running a one‑minute health check:
Count open cards per dev. If it exceeds 2 × team size, the lane is obese.
Measure average lead time (start‑to‑prod). Rising trend? Symptom of WIP bloat.
Spot idle PRs waiting on review—dead weight in disguise.
Next: treat flow, not busyness. Utilization feels productive. Flow is productive.
Stop measuring hours spent, start measuring days-to-done.
Move #1 – Swarm to Capacity, Don’t Sprinkle Resources
“One dev, one feature” looks tidy on a roadmap and disastrous in production.
When every engineer owns a different ticket, half the squad stalls on blockers, pull requests fossilize in review, and context fragments into confetti.
Flip the model: pick the one ticket that matters and throw a crew at it. A three‑person swarm—driver, navigator, reviewer—pairs in the same branch, rotates roles, and refuses to start anything else until the code is in prod. Idle minutes funnel into tests or docs, never into spawning new half‑done work.
How do you know you're still taking on too much at the same time?
Watch for:
cards that haven’t moved in 48 hours,
PRs waiting longer for review than they took to write,
the collective panic when Alice takes PTO.
The 3-2-1 Rule
3 engineers on the top ticket.
2 tickets max in “Doing.”
1 context in every brain.
It feels slower—fewer cards move across the board—but value lands sooner.
Don't just look busy. Treat a priority‑one feature like a burning building.
Shipping early beats starting early.
Move #2 – Put WIP on a Diet: Hard Limits, Healthy Flow
Picture an all‑you‑can‑eat buffet.
The bigger the plate, the colder the food. Your Kanban lane works the same way: the more tickets you pile on, the longer each one sits there, just waiting. A hard WIP limit shrinks the plate so work stays hot all the way to prod.
PRs are like sushi- best served fresh.
First, pick a WIP limit—team size + 1 is a good starter. If you have a virtual board, your favorite tool likely has a way to set that limit as well.
This isn’t a suggestion. It’s a traffic light. When the column fills, nobody pulls a new card until something ships. The board stalls, not the flow.
Put the rule to work:
Display the count: a big red badge that flips green when WIP ≤ limit. Visibility beats nagging.
Pull, don’t push: devs grab a ticket once capacity opens up. Never sooner.
Pair on bottlenecks: if you’re blocked, drag a teammate into your branch. Unblocking beats starting.
Review daily: during standup, figure out "What can we move to prod first?"
Less motion looks like less progress—until the first ticket lands two days early and lead time plummets.
30‑Day Implementation Playbook & Metrics Dashboard
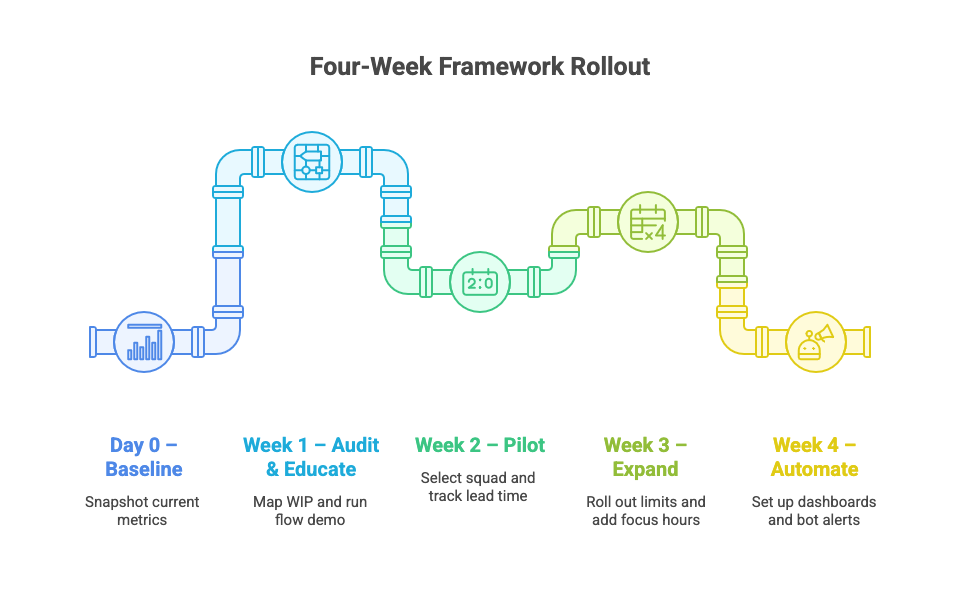
A new framework is only useful if it survives first contact with real calendars and real codebases. Here’s a four‑week rollout that keeps the change tight, visible, and hard to undo.
Day 0 – Baseline
Snapshot three numbers: current lead time (idea → prod), cards per engineer, and review‑to‑merge hours.
Week 1 — Audit & Educate
Map WIP: label every card with age and owner, highlight anything over five days.
Run a 15‑minute flow demo: show how lead time = WIP x throughput. Math beats opinions.
Week 2 — Pilot
Select one squad, set WIP = team size + 1.
Swarm the most stale ticket: nobody starts new work until it ships.
Track lead time daily
Week 3 — Expand
Roll hard limits to all squads; copy the pilot’s board settings.
Add focus hours (same slot across teams) to compound the swarming effects.
Install a WIP meter: a plugin or bot that turns red when limits bust.
Week 4 — Automate
Dashboards: surface lead time, WIP, and deployment frequency on an automated dashboard
Bot alerts when WIP > limit, raise an alarm
Retro: tighten caps if lead time hasn’t dropped significantly
Metrics that matter:
Lead time — idea to prod.
Throughput — tickets shipped per week.
WIP per dev — capacity health.
Review latency — code freshness.
Cut any one and the rest will follow.
Flow Is Your Competitive Edge
You don’t need more stand‑ups, bigger backlogs, or heroic overtime. You need fewer half‑started tickets and a team that swarms until Done turns green.
Slash WIP, protect flow, and you’ll watch lead‑time graphs fall like bad stock.
The beauty? Once engineers taste uninterrupted momentum, they’ll fight to keep it baked into the culture.


